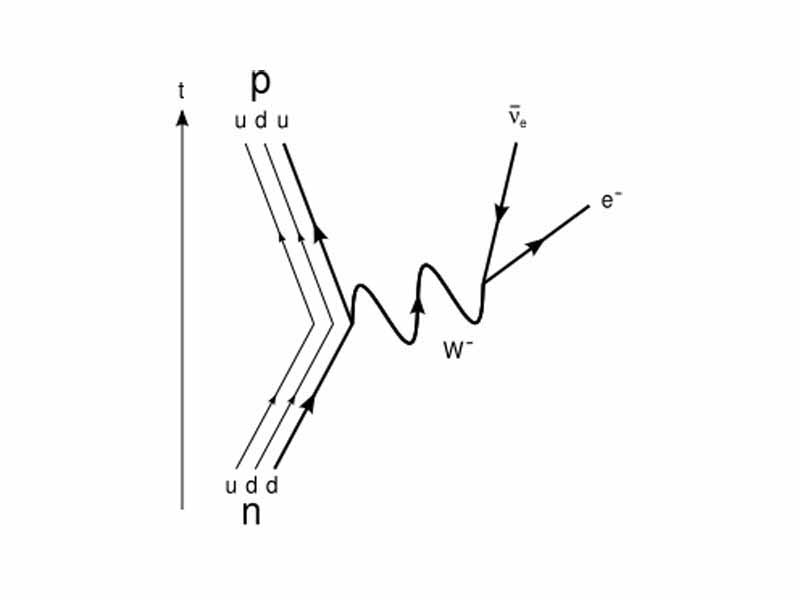
A Feynman diagram for beta decay. The straight lines in the diagrams represent fermions, while the wavy line represents virtual bosons.
Click this LINK to visit the original image and attribution information. Right click on the image to save the 800px teaching JPEG.