Statistics in Psychological Research
- Statistics is the study of the collection, analysis, interpretation, presentation, and organization of data.
- Descriptive statistics is the discipline of quantitatively describing the main features of a collection of information, or the quantitative description itself.
- Statistical inference is the process of deducing properties of an underlying distribution by analysis of data to infer properties about a population.
- In statistics, a central tendency is a central or typical value for a probability distribution.
- In mathematics and statistics, the arithmetic mean is the sum of a collection of numbers divided by the number of numbers in the collection.
- In statistics and probability theory, a median is the number separating the higher half of a data sample, a population, or a probability distribution, from the lower half.
- The mode is the value that appears most often in a set of data.
- In the normal distribution (or Gaussian distribution, sometimes informally called the bell curve) averages of random variables independently drawn from independent distributions converge in distribution to the normal.
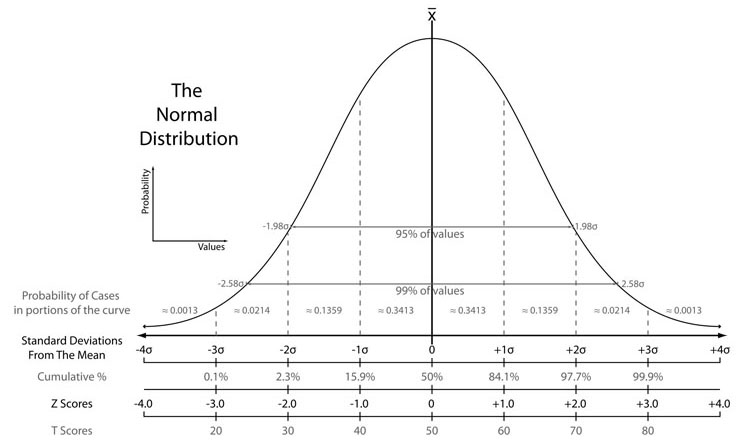
More probability density is found as one gets closer to the expected (mean) value in a normal distribution. Statistics used in standardized testing assessment are shown. The scales include standard deviations, cumulative percentages, percentile equivalents, Z-scores, T-scores, standard nines, and percentages in standard nines.
- Skewness is a measure of the asymmetry of the probability distribution of a real-valued random variable about its mean.
- Dispersion (also called variability, scatter, or spread) denotes how stretched or squeezed a distribution is. Common examples of measures of this property are the variance, standard deviation and interquartile range.
- The standard deviation is a measure that is used to quantify the amount of variation or dispersion of a set of data values.
- Statistical significance is attained when a p-value is less than the significance level. The p-value is the probability of obtaining at least as extreme results given that the null hypothesis is true. Significance level is chosen before data collection and is usually set to 0.05 (5%).

Example of two samples with the same mean and different standard deviations. Red sample has mean 100 and SD 10; blue sample has mean 100 and SD 50. Each sample has 1000 values drawn at random from a gaussian distribution with the specified parameters.
Normal distribution curve that illustrates standard deviations. Each band has 1 standard deviation, and the labels indicate the approximate proportion of area.

Remember that the probability of observing a result given that some hypothesis is true is not equivalent to the probability that a hypothesis is true given that some result has been observed. Using the p-value as a “score” is committing the transposed conditional fallacy.