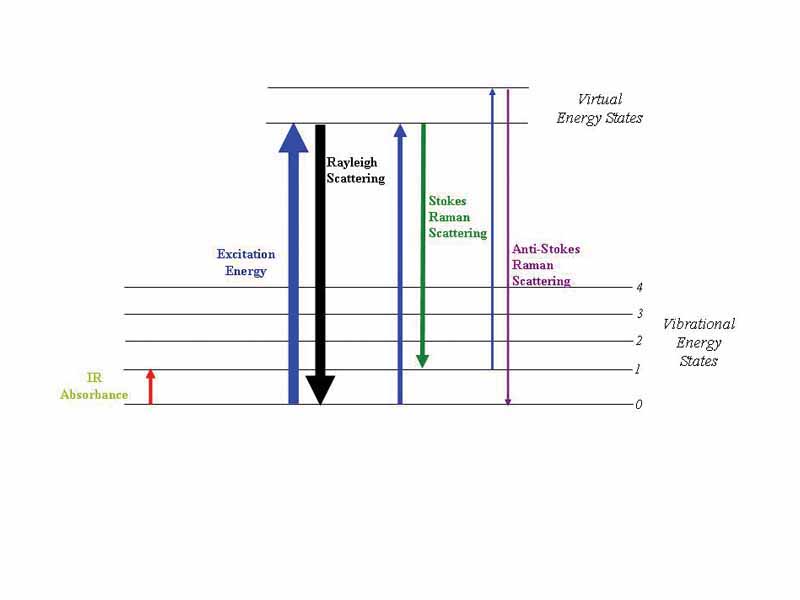
Energy level diagram showing the states involved in Raman signal. The line thickness is roughly proportional to the signal strength from the different transitions.
Click this LINK to visit the original image and attribution information. Right click on the image to save the 800px teaching JPEG.
